Databricks Observability: Collecting Cluster Ganglia Metrics
Introduction
This blog post is about a few host metrics like CPU and RAM usage and their importance in understanding cluster utilisation. The simple task of tracking them might turn into a non-trivial task if the number of clusters growing over time. The real challenge is to track such metrics for short-living job clusters. This post is the first one in related series and I will discuss further the problem of getting metrics gathered and the possible solution.
The problem: Data team has many clusters to monitor
Databricks cluster utilisation monitoring might be a simple task if the data team has a few “permanent” clusters to perform all data processing. These clusters have ganglia endpoints, so bookmarking the ganglia pages and checking each cluster’s health by looking into CPU, Memory, and Network charts from time to time might be enough to understand how clusters are doing.
However, things might be more complicated if the data team has dozens or even hundreds of clusters. Checking each cluster’s ganglia page to see bottlenecks or underutilisation will be tedious daily OPS work.
It might be even worse in case of workflows scheduled to run on job clusters that are created/destroyed during each run. In this case, the number of clusters might be counted in thousands per week. How then data team can see the average utilisation of the cluster that has about 15 minutes of the lifetime?
The solution: Collect cluster metrics centrally
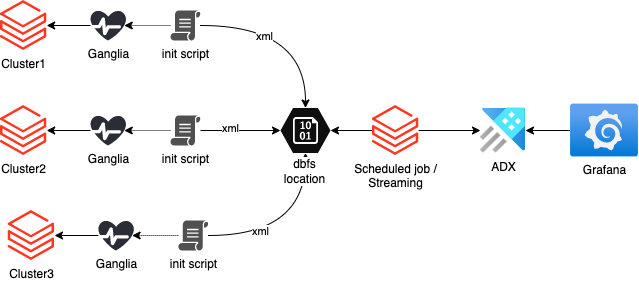
The solution is to collect cluster metrics centrally and store them for further observability using the push approach. Ganglia is a monitoring system that can be used to collect cluster statistics. But it will not be available when the cluster has already been destroyed.
A bash init script can be used to collect cluster metrics, and then store them in a central location. The script will start in the background during cluster start-up and will continuously collect the metrics at a specified interval and store them in a dbfs location shared among all clusters in the workspace.
These metrics can then be used with observability tools like Grafana to monitor cluster health and performance:
This blog post will cover the first part of the challenge: gathering data centrally to DBFS location.
What is Ganglia?
Before we proceed to the script writing, let’s make sure that the term Ganglia is clear.
Ganglia is a scalable, distributed monitoring tool for high-performance computing systems, clusters, and networks. The software is used to view either live or recorded statistics covering metrics such as CPU load averages or network utilization for many nodes.
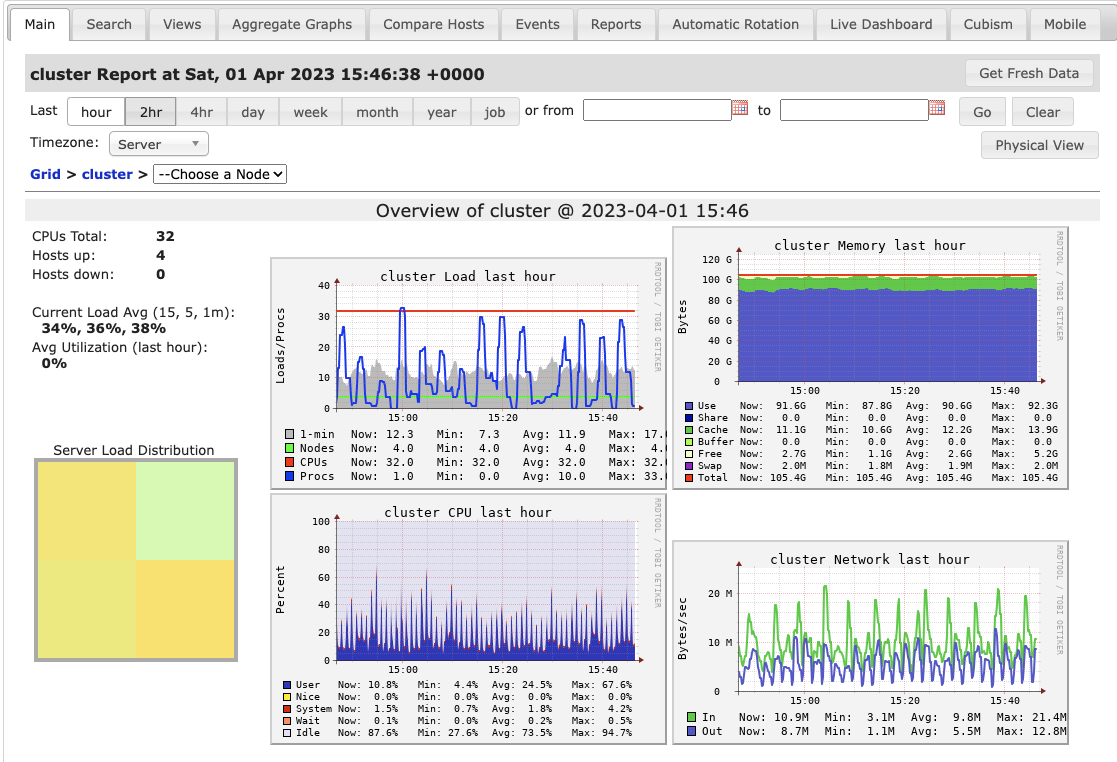
Ganglia is part of the Databricks offering and is available in interactive and job clusters by default in the Metrics tab:

The link will open a dashboard with a few basic metrics on top of the page and hundreds more hidden per category at the bottom:
The databricks driver also runs an endpoint which is available on port 8652 that returns an XML payload with instant values of the tracked metrics. It can be accessed directly from the notebook using the “magic” command “%sh” which enables a “shell” kernel and give access to the driver’s shell.
The following example can be executed directly in the notebook and it returns all metrics of the cluster:
%sh
curl localhost:8652/cluster
In the case of databricks, the number of metrics is measured in hundreds so the size of XML payload is measured in hundreds of kilobytes to a few megabytes, depending on the number of workers.
The URL can be tuned to get metrics of the single host:
%sh
curl localhost:8652/cluster/172.16.0.4/
The endpoint can return also specified metrics only.
In the example below worker name is replaced with an asterisk to get the metric “cpu_idle” from all hosts:
%sh
curl localhost:8652/cluster/*/cpu_idle
and the outcome is:
<GANGLIA_XML VERSION="3.6.0" SOURCE="gmetad">
<GRID NAME="unspecified" AUTHORITY="<http://0401-154024-wfoq75oh-172-16-0-4/ganglia/>" LOCALTIME="1680364998">
<CLUSTER NAME="cluster" LOCALTIME="1680364993" OWNER="unspecified" LATLONG="unspecified" URL="unspecified">
<HOST NAME="172.16.0.4" IP="172.16.0.4" REPORTED="1680364991" TN="6" TMAX="20" DMAX="0" LOCATION="unspecified" GMOND_STARTED="1680363793" TAGS="">
<METRIC NAME="cpu_idle" VAL="96.8" TYPE="float" UNITS="%" TN="24" TMAX="90" DMAX="0" SLOPE="both" SOURCE="gmond">
<EXTRA_DATA>
<EXTRA_ELEMENT NAME="GROUP" VAL="cpu"/>
<EXTRA_ELEMENT NAME="DESC" VAL="Percentage of time that the CPU or CPUs were idle and the system did not have an outstanding disk I/O request"/>
<EXTRA_ELEMENT NAME="TITLE" VAL="CPU Idle"/>
</EXTRA_DATA>
</METRIC>
</HOST>
<HOST NAME="172.16.0.5" IP="172.16.0.5" REPORTED="1680364986" TN="11" TMAX="20" DMAX="0" LOCATION="unspecified" GMOND_STARTED="1680363806" TAGS="">
<METRIC NAME="cpu_idle" VAL="98.4" TYPE="float" UNITS="%" TN="11" TMAX="90" DMAX="0" SLOPE="both" SOURCE="gmond">
<EXTRA_DATA>
<EXTRA_ELEMENT NAME="GROUP" VAL="cpu"/>
<EXTRA_ELEMENT NAME="DESC" VAL="Percentage of time that the CPU or CPUs were idle and the system did not have an outstanding disk I/O request"/>
<EXTRA_ELEMENT NAME="TITLE" VAL="CPU Idle"/>
</EXTRA_DATA>
</METRIC>
</HOST>
</CLUSTER>
</GRID>
</GANGLIA_XML>
Why not a native Spark Dropwizard metrics library?
Spark out of the box supports another metrics library which is also well documented: Dropwizard.
There is nothing wrong with it. It works, is flexible, and has many bundled sinks, like a console, CSV, Prometheus, JMX, etc.
It was not suitable in my research though because the metrics it gathers are Spark-centric.
For example, it shows the amount of memory and CPU time used by a certain task. But it does not show the memory and CPU utilisation on the hosts of the cluster. Therefore, this library is a great tool to analyse the resource usage by a certain process, but it does not help understand the main requirement – general cluster utilisation.
How-to configure databricks cluster to collect metrics
Since we already discussed the idea of a solution and the reasoning behind choices, it is time to get into the practical steps of configuration.
Step 1: Create an init script
The following snipped must be executed in the databricks notebook. It creates an init script in the DBFS location. In a such way, all clusters might be configured to have it attached.
%python

init_script_path = "/init-scripts/configure_ganglia_metrics.sh"
init_script = r"""#!/bin/bash

if [[ $GANGLIA_METRICS_ENABLED != "true" ]]; then
    echo "Ganglia metrics on $GANGLIA_METRICS_CLUSTER_NAME are not enabled"
    exit 0
fi

echo "Enabling collection of metrics on $GANGLIA_METRICS_CLUSTER_NAME"

cat <<'EOF' >> /tmp/gather_ganglia_metrics.sh
ROOT_PATH="/dbfs/logs/ganglia_metrics/in"
LOGS_DIR="$ROOT_PATH/$GANGLIA_METRICS_CLUSTER_NAME"

# Assign poll interval
re='^[0-9]+$'
if [[ $GANGLIA_METRICS_POLL_INTERVAL =~ $re ]] ; then
    POLL_INTEVAL=$GANGLIA_METRICS_POLL_INTERVAL
else
    POLL_INTEVAL="60"
fi

echo "Poll interval is $POLL_INTEVAL seconds"

if [[ ! -d $LOGS_DIR ]] ; then
sudo mkdir -p $LOGS_DIR
fi

while true; do

LOG_TIMESTAMP=$(date '+%Y%m%d%H%M%S')
LOG_PATH="$LOGS_DIR/$LOG_TIMESTAMP.xml"

curl <http://localhost:8652/cluster/*/{cpu_system,cpu_idle,cpu_user}> >> $LOG_PATH

sleep $POLL_INTEVAL
done
EOF
chmod a+x /tmp/gather_ganglia_metrics.sh
/tmp/gather_ganglia_metrics.sh & disown
"""

dbutils.fs.put(init_script_path, init_script, True)
Step 2: Attach the init script to the cluster
This can be done by editing the cluster and opening Advanced options:
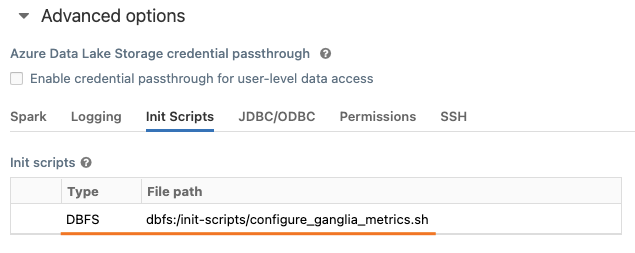
Step 3: Enable the ganglia script by setting-up environment variables
Open tab Spark and place required environment variables:
GANGLIA_METRICS_ENABLED=true
GANGLIA_METRICS_CLUSTER_NAME=myClusterName
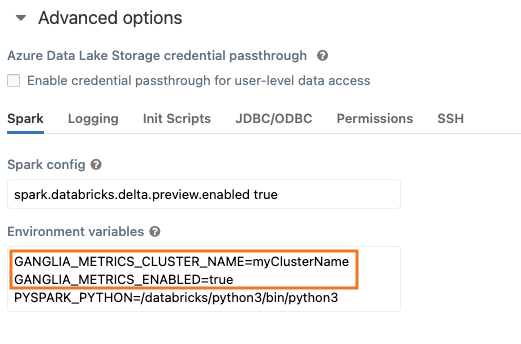
An optional one GANGLIA_METRICS_POLL_INTERVAL might also be used. It controls the frequency of polling in seconds. By default, it is set to 60.
Terraform
The cluster configuration might be simplified by adding: a few extra clauses to the cluster definition:
new_cluster {
	...
	init_scripts {
	  dbfs {
	    destination = "dbfs:/init-scripts/configure_ganglia_metrics.sh"
	  }
	}

	spark_env_vars = {
		  PYSPARK_PYTHON                = "/databricks/python3/bin/python3"
		  GANGLIA_METRICS_ENABLED       = true
		  GANGLIA_METRICS_POLL_INTERVAL = 30
		  GANGLIA_METRICS_CLUSTER_NAME  = "myClusterName"
		}
	}
	...
}
Checking the result
Restart the cluster, attach the notebook, and check if the destination location has any file generated:
%fs
ls /logs/ganglia_metrics/in/myClusterName

Congratulations, if the directory content looks similar to the image above. This means that the cluster generates XML payloads with specified metrics which are ready to be ingested into the observability tool of choice. However, the ingestion part if the topic of the next post.
Final words
In this blog post, I covered the problem of gathering databricks cluster metrics and explained how the gathering of them might be automated. In the next one, I will explain parsing logic and ingestion of the cleaned dataframe into the observability data engine.
Related information
Monitoring and Instrumentation – Spark 3.3.2 Documentation (apache.org)
Cluster node initialization scripts | Databricks on AWS
Persist Apache Spark CSV metrics to a DBFS location – Databricks