Databricks Observability: Processing Collected Ganglia Metrics
Introduction
In this article, we will explore the use of collected Ganglia metrics and their preparation for observability tools like Grafana. We will begin by examining how the metrics files are organized and what kind of content they hold. Then, we will discuss how the metrics going to be processed by creating a notebook to ingest XML files. Finally, we will push the metrics to Azure Data Explorer.
This article depends on the previous story: Databricks Observability: Collecting Ganglia Metrics and uses the outcome of the init-script discussed there.
The processing flow
Before the implementation part starts let’s briefly discuss the logic behind the processing.
In a nutshell, it has a few steps:
- Move logs from the landing to the processing directory
- Generate Pyspark dataframe by processing xml logs
- Push the content of the dataframe to Azure Data Explorer
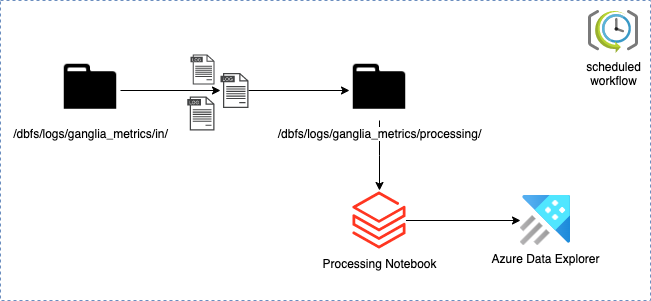
Each of these steps will be covered later in the implementation part.
Folder structure and the metrics content
The init script generates metrics using the following structure:
/dbfs/logs/ganglia_metrics/in/<cluster-name>/<driver_ip>_<timestamp>.xml
Each cluster has its own directory and the filename of the log contains a driver IP as the first token. Driver’s IP is needed to separate such host from workers since ganglia do not distinguish them:
<GANGLIA_XML VERSION="3.6.0" SOURCE="gmetad">
    <GRID NAME="unspecified" AUTHORITY="<http://0411-080835-6k8t703k-172-16-0-5/ganglia/>"
        LOCALTIME="1681494185">
        <CLUSTER NAME="cluster" LOCALTIME="1681494184" OWNER="unspecified" LATLONG="unspecified"
            URL="unspecified">
            <HOST NAME="172.16.0.4" IP="172.16.0.4" REPORTED="1681494182" TN="3" TMAX="20" DMAX="0"
                LOCATION="unspecified" GMOND_STARTED="1681493542" TAGS="">
                <METRIC NAME="cpu_num" VAL="4" TYPE="uint16" UNITS="CPUs" TN="43" TMAX="1200"
                    DMAX="0" SLOPE="zero" SOURCE="gmond">
                    <EXTRA_DATA>
                        <EXTRA_ELEMENT NAME="GROUP" VAL="cpu" />
                        <EXTRA_ELEMENT NAME="DESC" VAL="Total number of CPUs" />
                        <EXTRA_ELEMENT NAME="TITLE" VAL="CPU Count" />
                    </EXTRA_DATA>
                </METRIC>
            </HOST>
            <HOST NAME="172.16.0.5" IP="172.16.0.5" REPORTED="1681494177" TN="8" TMAX="20" DMAX="0"
                LOCATION="unspecified" GMOND_STARTED="1681493528" TAGS="">
                <METRIC NAME="cpu_num" VAL="4" TYPE="uint16" UNITS="CPUs" TN="56" TMAX="1200"
                    DMAX="0" SLOPE="zero" SOURCE="gmond">
                    <EXTRA_DATA>
                        <EXTRA_ELEMENT NAME="GROUP" VAL="cpu" />
                        <EXTRA_ELEMENT NAME="DESC" VAL="Total number of CPUs" />
                        <EXTRA_ELEMENT NAME="TITLE" VAL="CPU Count" />
                    </EXTRA_DATA>
                </METRIC>
            </HOST>
        </CLUSTER>
    </GRID>
</GANGLIA_XML>
Each file holds may hold multiple metrics of the cluster, however one xml payload per moment in time.
Implementation of the processing logic
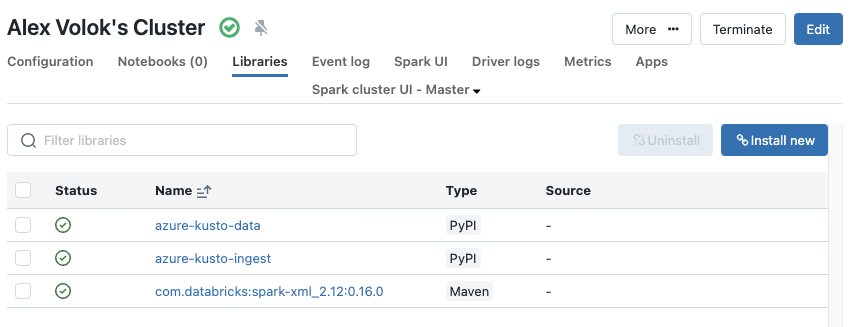
Step 1: Install extra libraries
Because gathered metrics are xml payloads and the destination target is Azure Data Explorer, the following library must be installed:
- Maven: com.databricks:spark-xml_2.12:0.16.0
- PyPI: azure-kusto-data
- PyPI: azure-kusto-ingest
This can be done manually by adjusting cluster settings:
If the cluster creation is managed by Terraform the missing module can be added using an attribute library in the scope of a cluster:
...
library {
      maven {
        coordinates = "com.databricks:spark-xml_2.12:0.16.0"
      }
    }
library {
      pypi {
        package = "azure-kusto-data"
      }
}
library {
      pypi {
        package = "azure-kusto-ingest"
      }
}
...
Step 2: Move logs to the processing folder
The following snippet moves files from /logs/ganglia_metrics/in to /logs/ganglia_metrics/processing. It terminates the notebook if the root ganglia_metrics folder does not exist or there are no input logs to process.
path_ganglia_root = "/logs/ganglia_metrics"
path_ganglia_input = f"{path_ganglia_root}/in"
path_ganglia_processing = f"{path_ganglia_root}/processing"
path_ganglia_processing_fetch_pattern = f"{path_ganglia_processing}/*/*"

# COMMAND ----------

# Check if ganglia root folder even created
# and if not then terminates the notebook flow
try:
    dbutils.fs.ls(path_ganglia_root)
except Exception as e:
    print(e)
    dbutils.notebook.exit("Ganglia metrics gathering is not enabled on any cluster in this opco, terminating...")

# Check if the metrics files available in the input folder
if not "in/" in [x.name for x in dbutils.fs.ls(path_ganglia_root)]:
    dbutils.notebook.exit("No input to process, terminating...")

# COMMAND ----------

# Moves incoming logs to the processing folder to isolate processing files from other processes
# 3 tries to move the files
try_nr = 1
moved = False
while not moved and try_nr <= 3:
    print(f"Moving files to processing folder. Try {try_nr}")
    try:
        dbutils.fs.mv(path_ganglia_input, path_ganglia_processing, True)
        moved = True
    except Exception as e: # Replace Exception with something more specific.
        print(e)
        try_nr += 1
Step 3: Generate dataframe by processing moved files
The following Pyspark snippet reads metric payloads and extracts clusters and metrics details:
from pyspark.sql.functions import input_file_name
df = (
    spark
    .read
    .format("xml")
    .option("rowTag", "HOST")
    .load(path_ganglia_processing_fetch_pattern)
    .withColumn("path", input_file_name())
    .selectExpr(
        "SPLIT(path, '/')[4] as cluster",
        "_NAME AS host",
        "METRIC._NAME AS metric",
        "METRIC._VAL AS value",
        "METRIC._UNITS AS units",
        "from_unixtime(_REPORTED) AS timestamp",
        "CASE WHEN SPLIT(SPLIT(path, '/')[5], '_')[0] = _NAME THEN 'Driver' ELSE 'Worker' END AS host_type"
    )
)
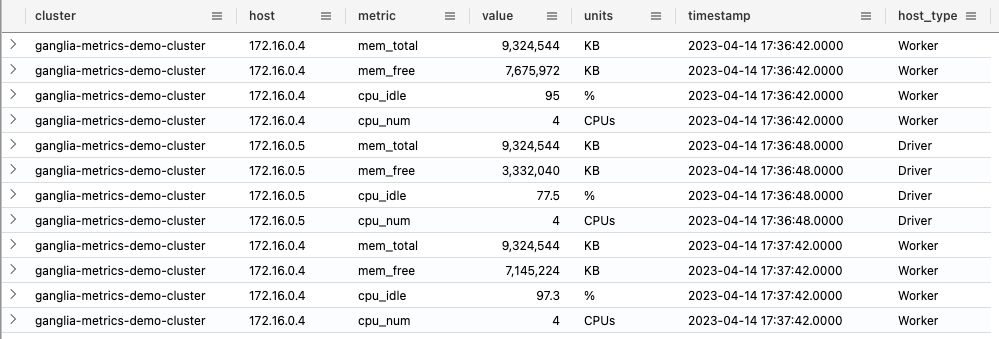
The outcome is a tabular flat dataset:
df.limit(5).show(truncate=False)
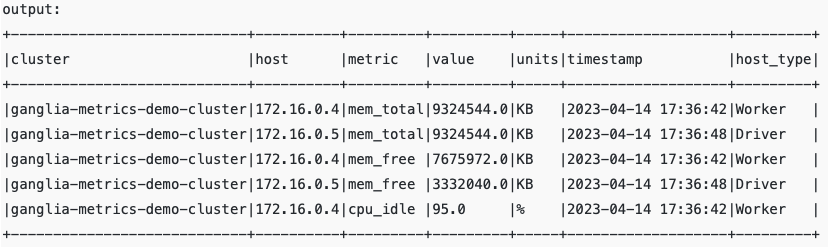
The dataframe df might be saved as the delta table. In some scenarios, this should be enough to analyze the health and utilization of the clusters. However, for a better user experience in observability tools like Grafana, the data will be exported to a more robust append-only query engine – Azure Data Explorer.
Step 4: Push the content of the dataframe to Azure Data Explorer
Warning: this is going the be the longest step since a few prerequisites must be implemented before running the code.
Prerequisites:
- Create or use existing SPN. Create an application secret. The Kusto client requires them for authentication.
- Create an instance of Azure Data Explorer and the database ganglia-metrics.
- Grant permission Ingestor to the SPN created in step 1 for the database created in step 2:
.add database ganglia-metrics ingestors ('aadapp=<Step 1 Application ID>')
- Run the following DDL script in ganglia-metrics to create a table cluster_usage:
.create table cluster_usage ( cluster: string, host: string, metric: string, value: decimal, units: string, timestamp: datetime, host_type:string)
- Create databricks secret scope ganglia-observability
- Create the following secrets in the added earlier secret scope:
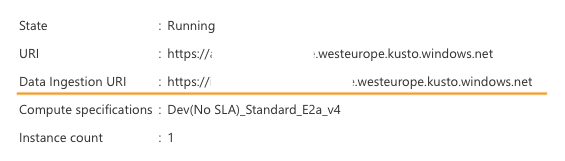
- ingest-connectionstring: Use the Data Ingestion URI of ADX, an example is in a screenshot below
- client-id: Application (client) ID
- client-secret: The secret string created in Step 1
- tenant-id: Directory (tenant) ID
Data Ingestion URI can be extracted from the Azure Data Explorer overview page:
As soon as the ADX prerequisites are fulfilled the following script might be executed. It converts spark dataframe into the CSV string and pushes that string asynchronously to Azure Data Explorer using a native Python client QueuedIngestClient:
from azure.kusto.data import KustoConnectionStringBuilder
from azure.kusto.ingest import QueuedIngestClient
from azure.kusto.ingest.ingestion_properties import IngestionProperties, DataFormat
from datetime import datetime
import io

kusto_database = "ganglia-metrics"
kusto_table = "cluster_usage"

secret_scope = "ganglia-observability"
kusto_ingest_uri = dbutils.secrets.get(secret_scope, "ingest-connectionstring")
client_id = dbutils.secrets.get(secret_scope, "client-id")
client_secret = dbutils.secrets.get(secret_scope, "client-secret")
tenant_id = dbutils.secrets.get(secret_scope, "tenant-id")

# initialises client to push messages
kusto_ingest_client = QueuedIngestClient(
    KustoConnectionStringBuilder.with_aad_application_key_authentication(
        connection_string=kusto_ingest_uri,
        aad_app_id=client_id,
        app_key=client_secret,
        authority_id=tenant_id
    )
)

# controls ingestion behavior
ingestion_properties = IngestionProperties(
    database=kusto_database,
    table=kusto_table,
    data_format=DataFormat.CSV,
    flush_immediately=True,
)

# converts the dataframe to csv string
adx_csv_output = df.toPandas().to_csv(index=False, header=False,)
payload_text = io.StringIO(adx_csv_output)

# pushes the payload message to data explorer
kusto_ingest_client.ingest_from_stream(
    payload_text,
    ingestion_properties
)
processed_rows = adx_csv_output.count("\\n")
print(f"{processed_rows} rows pushed appended into {kusto_database}.{kusto_table}")

# COMMAND ----------

# Final step: cleanup of the processing directory
dbutils.fs.rm(path_ganglia_processing, True)
If everything went well. the target table cluster_usage must contain metrics rows:
In the next articles, I will talk about the usage of the metrics data in Grafana and more detailed overview of the ADX as the observability engine.
The processing notebook code put together
The following notebook might be scheduled to process data periodically and refresh the target dataset
# Databricks notebook source
path_ganglia_root = "/logs/ganglia_metrics"
path_ganglia_input = f"{path_ganglia_root}/in"
path_ganglia_processing = f"{path_ganglia_root}/processing"

path_ganglia_processing_fetch_pattern = f"{path_ganglia_processing}/*/*"

# COMMAND ----------

# Check if ganglia root folder even created
# and if not then terminates the notebook flow
try:
    dbutils.fs.ls(path_ganglia_root)
except Exception as e:
    print(e)
    dbutils.notebook.exit("Ganglia metrics gathering is not enabled on any cluster in this opco, terminating...")

# Check if the metrics files available in the input folder
if not "in/" in [x.name for x in dbutils.fs.ls(path_ganglia_root)]:
    dbutils.notebook.exit("No input to process, terminating...")

# COMMAND ----------

# Moves incoming logs to the processing folder to isolate processing files from other processes
# 3 tries to move the files
try_nr = 1
moved = False
while not moved and try_nr <= 3:
    print(f"Moving files to processing folder. Try {try_nr}")
    try:
        dbutils.fs.mv(path_ganglia_input, path_ganglia_processing, True)
        moved = True
    except Exception as e: # Replace Exception with something more specific.
        print(e)
        try_nr += 1

# COMMAND ----------

# Ingests xmls using pyspark then converts to pandas to have control over generation of CSV output
from pyspark.sql.functions import input_file_name
df = (
    spark
    .read
    .format("xml")
    .option("rowTag", "HOST")
    .load(path_ganglia_processing_fetch_pattern)
    .withColumn("path", input_file_name())
    .selectExpr(
        "SPLIT(path, '/')[4] as cluster",
        "_NAME AS host",
        "METRIC._NAME AS metric",
        "METRIC._VAL AS value",
        "METRIC._UNITS AS units",
        "from_unixtime(_REPORTED) AS timestamp",
        "CASE WHEN SPLIT(SPLIT(path, '/')[5], '_')[0] = _NAME THEN 'Driver' ELSE 'Worker' END AS host_type"
    )
)

# COMMAND ----------

from azure.kusto.data import KustoConnectionStringBuilder
from azure.kusto.ingest import QueuedIngestClient
from azure.kusto.ingest.ingestion_properties import IngestionProperties, DataFormat
from datetime import datetime
import io

kusto_database = "ganglia-metrics"
kusto_table = "cluster_usage"

# to establish a connection with a data explorer
secret_scope = "ganglia-observability"
kusto_ingest_uri = dbutils.secrets.get(secret_scope, "ingest-connectionstring")
client_id = dbutils.secrets.get(secret_scope, "client-id")
client_secret = dbutils.secrets.get(secret_scope, "client-secret")
tenant_id = dbutils.secrets.get(secret_scope, "tenant-id")

# initialises client to push messages
kusto_ingest_client = QueuedIngestClient(
    KustoConnectionStringBuilder.with_aad_application_key_authentication(
        connection_string=kusto_ingest_uri,
        aad_app_id=client_id,
        app_key=client_secret,
        authority_id=tenant_id
    )
)

# controls ingestion behavior
ingestion_properties = IngestionProperties(
    database=kusto_database,
    table=kusto_table,
    data_format=DataFormat.CSV,
    flush_immediately=True,
)

# converts the dataframe to csv string
adx_csv_output = df.toPandas().to_csv(index=False, header=False,)
payload_text = io.StringIO(adx_csv_output)

# pushes the payload message to data explorer
kusto_ingest_client.ingest_from_stream(
    payload_text,
    ingestion_properties
)
processed_rows = adx_csv_output.count("\\n")
print(f"{processed_rows} rows pushed appended into {kusto_database}.{kusto_table}")

# COMMAND ----------

# Final step: cleanup of the processing directory
dbutils.fs.rm(path_ganglia_processing, True)
Final words
In this article, we explored the processing flow of the ganglia metrics. The XMLs parsing is done by databricks and then the data content pushed to chosen query engine which is Azure Data Explorer. In the following article, I will discuss the combination of Azure Data Explorer and Grafana and build charts for rendering CPU and memory stats.