Scripting PySpark DataFrames
Developing Spark applications means dealing with Spark DataFrames. These objects are in-memory data structures accessible via various APIs but locally scoped. Sometimes we need to use them outside the runtime environment. Scripting a dataframe as the collection of Python commands that fully reproduce this object is a possible and occasionally preferred solution.
The use cases
The most common example is a debugging of a production issue. So, think of a Data Processing framework built around Spark. It runs in a production environment, and you spot that one of the workflows fails. Further checks show that there is a flaw in the processing logic. It is handy to identify those few rows on which the processing crashes, create a dataframe and then transfer it to your development environment.
The transported dataframe might then be used for the following:
- Debugging the issue in the development/feature environment
- Creating a unit test for preventing such kind of errors
- Creating a default sample data when the new development/feature environment must be deployed
Why not just save the dataframe as parquet?
Some will ask: “Why bother with scripting if the dataframe can be dumped as a parquet file?”.
The quick answer is that parquet is a binary format; it is very efficient but hard to be viewed and edit using text tools.
The Python script of the dataframe contains both data and schema and can be edited in place when needed, bringing flexibility. The dataframe script can eventually be turned into a parameterized Pytest fixture to enable multiple testing scenarios without crafting a set of binary files for each one.
Another aspect is Git. Git handles plain text/code better than binary content. The data team might use small parquet/delta files as the input for unit tests. The peer reviewer cannot see what changed if its data content must be updated.
And as the analogy from the database world: there are scenarios when binary backup might be the most robust and preferred solution. Still, sometimes a script with a table definition and few insert statements is better.
Scripting a dataframe in practice
Before we proceed with an example, let’s define a sample dataframe with a complex enough schema:
df = spark.sql(
    """
    SELECT
        1 AS ID,
        "John Doe" AS Name,
        STRUCT(
            "line1" AS Line1,
            "line2" AS Line2
        ) AS Address,
        TO_DATE("1980-01-01") AS BirthDate,
        ARRAY(
            STRUCT(
                012345678 AS AccountNumber,
                "NL" AS CountryCode,
                1005.50 AS Balance
            ),
            STRUCT(
                012345678 AS AccountNumber,
                "UK" AS CountryCode,
                NULL AS Balance
            )
        ) AS BankAccounts
    """
)
df.printSchema()


"""
root
 |-- ID: integer (nullable = false)
 |-- Name: string (nullable = false)
 |-- Address: struct (nullable = false)
 |    |-- Line1: string (nullable = false)
 |    |-- Line2: string (nullable = false)
 |-- BirthDate: date (nullable = true)
 |-- BankAccounts: array (nullable = false)
 |    |-- element: struct (containsNull = false)
 |    |    |-- AccountNumber: integer (nullable = false)
 |    |    |-- CountryCode: string (nullable = false)
 |    |    |-- Balance: decimal(6,2) (nullable = true)
"""
The dataframe can be one-line scripted using a custom helper function script_dataframe() which returns generated code as the string output:
dataframe_script = script_dataframe(df)
print(dataframe_script)
The content of the dataframe_script is a Python snippet that is small enough to be copy-pasted, edited if needed (to remove PII data, for instance), and executed in any other environment. It contains __data, a collection of rows, and __schema that holds an exact schema of the scripted dataframe:
from pyspark.sql import Row
import datetime
from decimal import Decimal
from pyspark.sql.types import *

# Scripted data and schema:
__data = [
    Row(
        ID=1,
        Name="John Doe",
        Address=Row(Line1="line1", Line2="line2"),
        BirthDate=datetime.date(1980, 1, 1),
        BankAccounts=[
            Row(AccountNumber=12345678, CountryCode="NL", Balance=Decimal("1005.50")),
            Row(AccountNumber=12345678, CountryCode="UK", Balance=None),
        ],
    )
]
__schema = StructType.fromJson(
    {
        "type": "struct",
        "fields": [
            {"name": "ID", "type": "integer", "nullable": False, "metadata": {}},
            {"name": "Name", "type": "string", "nullable": False, "metadata": {}},
            {
                "name": "Address",
                "type": {
                    "type": "struct",
                    "fields": [
                        {"name": "Line1", "type": "string", "nullable": False, "metadata": {}},
                        {"name": "Line2", "type": "string", "nullable": False, "metadata": {}},
                    ],
                },
                "nullable": False,
                "metadata": {},
            },
            {"name": "BirthDate", "type": "date", "nullable": True, "metadata": {}},
            {
                "name": "BankAccounts",
                "type": {
                    "type": "array",
                    "elementType": {
                        "type": "struct",
                        "fields": [
                            {
                                "name": "AccountNumber",
                                "type": "integer",
                                "nullable": False,
                                "metadata": {},
                            },
                            {
                                "name": "CountryCode",
                                "type": "string",
                                "nullable": False,
                                "metadata": {},
                            },
                            {
                                "name": "Balance",
                                "type": "decimal(6,2)",
                                "nullable": True,
                                "metadata": {},
                            },
                        ],
                    },
                    "containsNull": False,
                },
                "nullable": False,
                "metadata": {},
            },
        ],
    }
)

outcome_dataframe = spark.createDataFrame(__data, __schema)
Let’s verify if the script works correctly by running it and exploring the dataframe content:
outcome_dataframe.show(truncate=False)

"""
+---+--------+--------------+----------+-----------------------------------------------+
|ID |Name    |Address       |BirthDate |BankAccounts                                   |
+---+--------+--------------+----------+-----------------------------------------------+
|1  |John Doe|{line1, line2}|1980-01-01|[{12345678, NL, 1005.50}, {12345678, UK, null}]|
+---+--------+--------------+----------+-----------------------------------------------+
"""

outcome_dataframe.printSchema()

"""
root
 |-- ID: integer (nullable = false)
 |-- Name: string (nullable = false)
 |-- Address: struct (nullable = false)
 |    |-- Line1: string (nullable = false)
 |    |-- Line2: string (nullable = false)
 |-- BirthDate: date (nullable = true)
 |-- BankAccounts: array (nullable = false)
 |    |-- element: struct (containsNull = false)
 |    |    |-- AccountNumber: integer (nullable = false)
 |    |    |-- CountryCode: string (nullable = false)
 |    |    |-- Balance: decimal(6,2) (nullable = true)
"""
Limitations
The logic of script_dataframe() internally relies on DataFrame.collect(), which means it gathers all scripted rows in Spark’s driver. Therefore, the function is intended to dump relatively small dataframes. By default, it limits the number of rows to 20, but that limit can be increased using an extra parameter limit_rows.
Source code
The following code was tested and runs in PySpark and Databricks:
from pprint import pformat
from pyspark.sql import DataFrame

def script_dataframe(
    input_dataframe: DataFrame, limit_rows: int = 20
) -> str:
    """Generate a script to recreate the dataframe
    The script includes the schema and the data

    Args:
        input_dataframe (DataFrame): Input spark dataframe
        limit_rows (int, optional): Prevents too large dataframe to be processed. \
            Defaults to 20.

    Raises:
        ValueError: when the dataframe is too large (by default > 20 rows)

    Returns:
        The script to recreate the dataframe

    Examples:
        >>> script = script_dataframe(input_dataframe=df)
        >>> print(script)
    """

    if input_dataframe.count() > limit_rows:
        raise ValueError(
            "This method is limited to script up "
            f"to {limit_rows} row(s) per call"
        )

    __data = pformat(input_dataframe.collect())

    __schema = input_dataframe.schema.jsonValue()

    __script_lines = [
        "from pyspark.sql import Row",
        "import datetime",
        "from decimal import Decimal",
        "from pyspark.sql.types import *",
        "",
        "# Scripted data and schema:",
        f"__data = {__data}",
        f"__schema = StructType.fromJson({__schema})",
        "",
        "outcome_dataframe = spark.createDataFrame(__data, __schema)",
    ]

    __final_script = "\n".join(__script_lines)

    return __final_script
Final words
While the PySpark dataframe scripting is not (yet) part of the native functionality, it is a relatively simple operation. It can be done via the custom helper function script_dataframe() I shared above. It helps me to craft unit tests faster and to make the processing frameworks more reliable. I hope it will also help you in your PySpark journey.
Delta Properties and Check Constraints at Scale
Delta arguably is the most popular data format in the current Data Engineering landscape. It is mainly used with Databricks/Spark ecosystem; however, this is optional. It is a universal open-source format and works great out of the box. However, it might be that the default behavior is not sufficient for some use cases, and then custom table-level properties must be defined.
It is not that hard to hit that point. To define the Delta table property or the check constraint, you have the only option — ALTER TABLE statement. This command is easy to embed in an ad-hoc notebook. What to do when there are no manual processes and delta objects are delivered in a fully automated way using config-driven Python pipelines?
This story answers the question above and reveals my path from the exploration to the solution that scales.
Prepare a clean environment
First thing first, let’s prepare a clean Python environment to run showcase examples.
Traditionally, I am going to run the code on Apple Silicon; however, all snippets must be compatible with Linux and WSL of Windows 10/11:
mkdir delta-properties
cd delta-properties
python3.10 -m venv .venv
source .venv/bin/activate
pip install pyspark==3.3.1 delta-spark==2.3.0
touch delta-properties.ipynb
code .
Then initialize the minimalistic configuration of Spark with the latest delta jar, and disable all Spark UI:
from pyspark.sql import SparkSession

spark = (
    SparkSession.builder.master("local[*]")
    .appName("MyApp")
    .config("spark.jars.packages", "io.delta:delta-core_2.12:2.3.0")
    .config("spark.sql.extensions", "io.delta.sql.DeltaSparkSessionExtension")
    .config(
        "spark.sql.catalog.spark_catalog",
        "org.apache.spark.sql.delta.catalog.DeltaCatalog",
    )
    .config("spark.ui.showConsoleProgress", "false")
    .config("spark.ui.enabled", "false")
    .config("spark.ui.dagGraph.retainedRootRDDs", "1")
    .config("spark.ui.retainedJobs", "1")
    .config("spark.ui.retainedStages", "1")
    .config("spark.ui.retainedTasks", "1")
    .config("spark.sql.ui.retainedExecutions", "1")
    .config("spark.worker.ui.retainedExecutors", "1")
    .config("spark.worker.ui.retainedDrivers", "1")
    .config("spark.driver.memory", "4g")
).getOrCreate()
When the spark is up, create a sample delta table that will be the subject of coming experiments:
df = spark.sql(
    """
    SELECT
        1 as id,
        "John" AS name,
        struct(
            "Longstreet 1" AS line1,
            "1234AB" AS zipcode
        ) AS address
""")
df.printSchema()

"""
root
 |-- id: integer (nullable = false)
 |-- name: string (nullable = false)
 |-- address: struct (nullable = false)
 |    |-- line1: string (nullable = false)
 |    |-- zipcode: string (nullable = false)
"""

df.write.format("delta").mode("overwrite").save("/tmp/sample_delta_dataset")
A real-world example
So you build a Spark-based data processing framework. You want to improve Structured Streaming latencies by modifying default table properties. Because the streaming logic uses.ForEachBatch with a MERGE statement, you also plan to add NOT NULL constraints on Primary Key columns in the silver layer.
Table Properties
This part is easy to construct with a bit of dynamic SQL and then embed into the framework, and it will work:
spark.sql(
    """
    ALTER TABLE delta.`/tmp/sample_delta_dataset`
    SET TBLPROPERTIES (
        delta.checkpoint.writeStatsAsStruct = true,
        delta.checkpoint.writeStatsAsJson = false
    );
    """
)
However, the framework triggered the data load five times, and you noticed that Delta History is polluted by the SET TBLPROPERTIES messages:
(
    spark.sql(
        "DESCRIBE HISTORY delta.`/tmp/sample_delta_dataset`;"
    ).select("version", "operation", "operationParameters")
    .show(truncate=False)
)

"""
+-------+-----------------+----------------------------------------------------------------------------------------------------------+
|version|operation        |operationParameters                                                                                       |
+-------+-----------------+----------------------------------------------------------------------------------------------------------+
|5      |SET TBLPROPERTIES|{properties -> {"delta.checkpoint.writeStatsAsStruct":"true","delta.checkpoint.writeStatsAsJson":"false"}}|
|4      |SET TBLPROPERTIES|{properties -> {"delta.checkpoint.writeStatsAsStruct":"true","delta.checkpoint.writeStatsAsJson":"false"}}|
|3      |SET TBLPROPERTIES|{properties -> {"delta.checkpoint.writeStatsAsStruct":"true","delta.checkpoint.writeStatsAsJson":"false"}}|
|2      |SET TBLPROPERTIES|{properties -> {"delta.checkpoint.writeStatsAsStruct":"true","delta.checkpoint.writeStatsAsJson":"false"}}|
|1      |SET TBLPROPERTIES|{properties -> {"delta.checkpoint.writeStatsAsStruct":"true","delta.checkpoint.writeStatsAsJson":"false"}}|
|0      |WRITE            |{mode -> Overwrite, partitionBy -> []}                                                                    |
+-------+-----------------+----------------------------------------------------------------------------------------------------------+
"""
This is not a perfect situation, but still not a roadblock. At the end of the day, you can write the script that checks current table properties and changes them only when needed.
Table Check Constraints
Similarly to table properties, you extend the framework to create NOT NULL constraints for each Primary Key column of the input dataset config, so the logic gets one more dynamically generated SQL command:
spark.sql(
    """
    ALTER TABLE delta.`/tmp/sample_delta_dataset`
    ADD CONSTRAINT id_is_not_null CHECK (id is not null)
    """
)
The first time it runs correctly, but the consecutive runs break the execution flow:
AnalysisException: Constraint 'id_is_not_null' already exists. Please delete the old constraint first.
Old constraint: id is not null
This time, things get nastier. The error is a blocker and must be fixed in a structured way.
An elephant in the room
This elephant is a generation of SQL DDL statements. It is not just a non-Pythonic way to deal with this problem. The embedded DDL statements are hard for abstraction, not always idempotent, and inconvenient for unit testing.
Ideally, the official Delta-Spark package must contain the logic to deal with such tasks. However, at this point, the existing official class DeltaTable does not have any Python abstraction for properties, constraints, table metadata, etc. So it still must be defined using SQL DDL format.
What about native NOT NULL column constraint
Some may ask why I define a table-level constraint to enforce NOT NUL for a particular column while the documentation says it is possible to do on the column level:
spark.sql(
    """
    ALTER TABLE delta.`/tmp/sample_delta_dataset`
    CHANGE COLUMN id SET NOT NULL;
    """
)
Even though such column-level Constraints are documented and must be supported, I failed to make them work in Databricks 11.3 and Spark 3.3.1. The command fails with the same error in both offerings:
AnalysisException: Cannot change nullable column to non-nullable: id; line 2 pos 4;
AlterColumn resolvedfieldname(StructField(id,IntegerType,true)), false
I hope this issue will be solved soon, but for the time being, check constraints are used instead.
The internal benchmarks show that the overhead of table constraint checks is relatively tiny in data manipulation operations; however, due to the mentioned issue, I cannot directly compare table and column-level constraints.
An alternative using Python
The limitations mentioned earlier and the vision of having a “desired state configuration” kind of experience brought me to the need to write a Python abstraction around the discussed subject. So, to abstract the configuration process of the Delta tables. That all resulted in the Python class DeltaTableConfig.
Table Properties
So, the first example. The framework knows that the table sample_delta_dataset is a streaming dataset, and it prescribes the following two standard options for such a kind table:
STREAMING_PROPERTIES = {
    "delta.checkpoint.writeStatsAsStruct": "true",
    "delta.checkpoint.writeStatsAsJson": "false",
}
dtc = DeltaTableConfig(table_path="/tmp/sample_delta_dataset")
dtc.properties = STREAMING_PROPERTIES
The first run enables the properties:
2023-05-21 16:03:35 INFO   Applying table properties on 'delta.`/tmp/sample_delta_dataset`':
2023-05-21 16:03:35 INFO   Checking if 'delta.checkpoint.writeStatsAsStruct = true' is set on delta.`/tmp/sample_delta_dataset`
2023-05-21 16:03:36 INFO   The property has been set
2023-05-21 16:03:36 INFO   Checking if 'delta.checkpoint.writeStatsAsJson = false' is set on delta.`/tmp/sample_delta_dataset`
2023-05-21 16:03:36 INFO   The property has been set
And the following runs detect that properties already exist so it has nothing to do:
2023-05-21 16:09:06 INFO   Applying table properties on 'delta.`/tmp/sample_delta_dataset`':
2023-05-21 16:09:06 INFO   Checking if 'delta.checkpoint.writeStatsAsStruct = true' is set on delta.`/tmp/sample_delta_dataset`
2023-05-21 16:09:06 INFO   The property already exists on the table
2023-05-21 16:09:06 INFO   Checking if 'delta.checkpoint.writeStatsAsJson = false' is set on delta.`/tmp/sample_delta_dataset`
2023-05-21 16:09:06 INFO   The property already exists on the table
The check of delta history confirms that the property-related messages appear in a single instance:
(
    spark.sql(
        "DESCRIBE HISTORY delta.`/tmp/sample_delta_dataset`;"
    ).select("version", "operation", "operationParameters")
    .show(truncate=False)
)

+-------+-----------------+--------------------------------------------------------------+
|version|operation        |operationParameters                                           |
+-------+-----------------+--------------------------------------------------------------+
|2      |SET TBLPROPERTIES|{properties -> {"delta.checkpoint.writeStatsAsJson":"false"}} |
|1      |SET TBLPROPERTIES|{properties -> {"delta.checkpoint.writeStatsAsStruct":"true"}}|
|0      |WRITE            |{mode -> Overwrite, partitionBy -> []}                        |
+-------+-----------------+--------------------------------------------------------------+
Imagine another scenario: the table type changed from “streaming” to “append-only.” The framework might have different options for that kind of table:
APPEND_ONLY_PROPERTIES = {
    "delta.appendOnly": "true",
    "delta.enableChangeDataFeed": "true",
}
dtc.properties = APPEND_ONLY_PROPERTIES
The DeltaTableConfig unsets previous properties and sets two new items:
2023-05-21 16:17:06 INFO   Applying table properties on 'delta.`/tmp/sample_delta_dataset`':
2023-05-21 16:17:06 INFO   Checking if 'delta.appendOnly = true' is set on delta.`/tmp/sample_delta_dataset`
2023-05-21 16:17:07 INFO   The property has been set
2023-05-21 16:17:07 INFO   Checking if 'delta.enableChangeDataFeed = true' is set on delta.`/tmp/sample_delta_dataset`
2023-05-21 16:17:07 INFO   The property has been set
2023-05-21 16:17:08 INFO   The property 'delta.checkpoint.writeStatsAsStruct = true' has been unset because it is not defined in the original dict
2023-05-21 16:17:08 INFO   The property 'delta.checkpoint.writeStatsAsJson = false' has been unset because it is not defined in the original dict
If the new properties must be added with keeping all existing ones, use the flag .keep_existing_properties = True. So, let’s re-add previously removed delta properties:
dtc.keep_existing_properties = True
dtc.properties = STREAMING_PROPERTIES
The attribute .properties acts as a getter and setter, so the existing values can be retrieved by getting the value of the attribute:
from pprint import pprint
pprint(dtc.properties)

{'delta.appendOnly': 'true',
 'delta.checkpoint.writeStatsAsJson': 'false',
 'delta.checkpoint.writeStatsAsStruct': 'true',
 'delta.enableChangeDataFeed': 'true'}
Under the hood, the helper class runs DeltaTable.detail()each time to get the current state.
Check Constraints
Similarly to the Table Properties, the data processing framework can pre-generate the input dictionary PK_CHECK_CONSTRAINTS with the constraints definitions to add. DeltaTableConfig then adds prescribed check constraints if they still need to be created.
dtc = DeltaTableConfig(table_path="/tmp/sample_delta_dataset")

PK_CHECK_CONSTRAINTS = {
    "id_is_not_null": "id is not null",
}
dtc.check_constraints = PK_CHECK_CONSTRAINTS
results to the output:
2023-05-21 16:30:00 INFO   Applying check constraints on 'delta.`/tmp/sample_delta_dataset`':
2023-05-21 16:30:00 INFO   Checking if constraint 'id_is_not_null' was already set on delta.`/tmp/sample_delta_dataset`
2023-05-21 16:30:01 INFO   The constraint id_is_not_null has been successfully added to 'delta.`/tmp/sample_delta_dataset`'
In case of new constraints are to be added instead of existing ones, provide the new dictionary to apply:
NEW_CHECK_CONSTRAINTS = {
    "address_zipcode_is_not_null": "address.zipcode is not null",
}
dtc.check_constraints = NEW_CHECK_CONSTRAINTS
As you might expect, the old constraint is removed, and a new one is added:
2023-05-21 16:32:00,180 INFO    Applying check constraints on 'delta.`/tmp/sample_delta_dataset`':
2023-05-21 16:32:01,085 INFO    The constraint 'id_is_not_null' has been dropped from the table 'delta.`/tmp/sample_delta_dataset`'
2023-05-21 16:32:01,085 INFO    Checking if constraint 'address_zipcode_is_not_null' was already set on delta.`/tmp/sample_delta_dataset`
2023-05-21 16:32:01,616 INFO    The constraint address_zipcode_is_not_null has been successfully added to 'delta.`/tmp/sample_delta_dataset`'
If existing check constraints must be preserved, use the optional argument .keep_existing_check_constraints=True
dtc.keep_existing_check_constraints = True
dtc.check_constraints = PK_CHECK_CONSTRAINTS
All existing constraints can be programmatically retrieved via getter .check_constraints:
print(dtc.check_constraints)

{
    'address_zipcode_is_not_null': 'address.zipcode is not null',
    'id_is_not_null': 'id is not null'
}
Delta Table Check Constraints in Action
Let’s then run a final smoke test to ensure that all those constraint efforts pay back:
spark.sql(
    """
    INSERT INTO delta.`/tmp/sample_delta_dataset`
    VALUES (1, 'John Doe', STRUCT('123 Main St', '10001'))
    """
)
So, the insert with non-null values works as expected.
The following command intentionally inserts a NULL in the nested attribute address.zipcode, which is protected by the recently added check constraint:
spark.sql(
    """
    INSERT INTO delta.`/tmp/sample_delta_dataset`
    VALUES (1, 'John Doe', STRUCT('123 Main St', NULL))
    """
)

"""
org.apache.spark.sql.delta.schema.DeltaInvariantViolationException:
CHECK constraint address_zipcode_is_not_null (address.zipcode IS NOT NULL) violated by row with values:
 - address.zipcode : null
"""
The code fails with a clear message that must eventually trigger the data team to fix the issue.
The source code
from delta import DeltaTable
from pyspark.sql import SparkSession
from typing import Union
import logging


def get_logger(name: str):
    """Returns an instance of the logger"""

    logger = logging.getLogger(name)
    logger.setLevel(logging.INFO)

    if not logger.handlers:
        handler = logging.StreamHandler()
        formatter = logging.Formatter("%(asctime)s %(levelname)-8s  %(message)s")
        handler.setFormatter(formatter)
        logger.addHandler(handler)

    return logger


logger = get_logger(__name__)


class DeltaTableConfig:
    """
    Manages Delta Table properties, constraints, etc.
    Attributes:
        keep_existing_properties (bool): Preserves existing table properties if they are not
                                                in the input value. Defaults to False
        keep_existing_check_constraints (bool): Preserves existing table constraints if they are not
                                                in the input value. Defaults to False
    """

    keep_existing_properties = False
    keep_existing_check_constraints = False

    def __init__(
        self,
        table_path: str = "",
        table_name: str = "",
        spark_session: SparkSession = None,
    ) -> None:
        """
        Args:
            table_path (str, optional): Path to delta table. For instance: /mnt/db1/table1
            table_name (str, optional): Delta table name. For instance: db1.table1
            spark_session: (SparkSession, optional)  The current spark context.
        Raises:
            ValueError: if values for both 'table_path' and 'table_name' provided
                        provide values to one of them
            ValueError: if values for neither 'table_path' nor 'table_name' provided
                        provide values to one of them
        Examples:
            >>> from spalah.dataset import DeltaTableConfig
            >>> dp = DeltaTableConfig(table_path="/path/dataset")
            >>> print(dp.properties)
            {'delta.deletedFileRetentionDuration': 'interval 15 days'}
        """

        self.spark_session = (
            SparkSession.getActiveSession() if not spark_session else spark_session
        )
        self.table_name = self.__get_table_identifier(
            table_path=table_path, table_name=table_name
        )
        self.original_table_name = table_name

    def __get_table_identifier(
        self,
        table_path: str = "",
        table_name: str = "",
    ) -> Union[str, None]:
        """Constructs table identifier from provided values."""

        if table_path and table_name:
            raise ValueError(
                "Both 'table_path' and 'table_name' provided. Use one of them."
            )

        if not table_path and not table_name:
            raise ValueError(
                "Neither 'table_path' nor 'table_name' provided. Use one of them."
            )

        if table_path:
            table_name = f"delta.`{table_path}`"
            _identifier = table_path
        else:
            _identifier = table_name

        if not DeltaTable.isDeltaTable(
            sparkSession=self.spark_session, identifier=_identifier
        ):
            logger.warning(f"{table_name} is not a Delta Table")
            return None

        return table_name

    @property
    def properties(self) -> Union[dict, None]:
        """Gets/sets dataset's delta table properties.
        Args:
            value (dict):  An input dictionary in the format: `{"property_name": "value"}`
        Examples:
            >>> from spalah.dataset import DeltaTableConfig
            >>> dp = DeltaTableConfig(table_path="/path/dataset")
            >>>
            >>> # get existing properties
            >>> print(dp.properties)
            {'delta.deletedFileRetentionDuration': 'interval 15 days'}
            >>>
            >>> # Adjust the property value from 15 to 30 days
            >>> dp.properties = {'delta.deletedFileRetentionDuration': 'interval 30 days'}
        """

        if self.table_name:
            existing_properties = (
                self.spark_session.sql(f"DESCRIBE DETAIL {self.table_name}")
                .select("properties")
                .collect()[0]
                .asDict()["properties"]
            )
        else:
            existing_properties = None

        return existing_properties

    @properties.setter
    def properties(
        self,
        value: dict,
    ) -> None:
        """Sets delta properties
        Args:
            value (dict):  An input dictionary in the format: `{"property_name": "value"}`
        """

        _existing_properties = self.properties
        _new_properties = value

        if self.table_name:
            logger.info(f"Applying table properties on '{self.table_name}':")

            for k, v in _new_properties.items():
                logger.info(f"Checking if '{k} = {v}' is set on {self.table_name}")

                if k in _existing_properties and _existing_properties[k] == str(v):
                    logger.info("The property already exists on the table")
                else:
                    _sql = (
                        f"ALTER TABLE {self.table_name} SET TBLPROPERTIES ({k} = '{v}')"
                    )
                    self.spark_session.sql(_sql)
                    logger.info("The property has been set")

            if not self.keep_existing_properties:
                for k, v in _existing_properties.items():
                    if k not in _new_properties:
                        _sql = (
                            f"ALTER TABLE {self.table_name} UNSET TBLPROPERTIES ({k})"
                        )
                        self.spark_session.sql(_sql)
                        logger.info(
                            f"The property '{k} = {v}' has been unset because it is not defined in "
                            "the original dict"
                        )

    @property
    def check_constraints(self) -> Union[dict, None]:
        """Gets/sets dataset's delta table check constraints.
        Args:
            value (dict):  An input dictionary in the format: `{"property_name": "value"}`
        Examples:
            >>> from spalah.dataset import DeltaTableConfig
            >>> dp = DeltaTableConfig(table_path="/path/dataset")
            >>>
            >>> # get existing constraints
            >>> print(dp.check_constraints)
            {}
            >>>
            >>> # Add a new check constraint
            >>> dp.check_constraints = {'id_is_not_null': 'id is not null'}
        """

        _constraints = {}

        if self.table_name:
            for k, v in self.properties.items():
                if k.startswith("delta.constraints."):
                    _new_key = k.replace("delta.constraints.", "")
                    _constraints[_new_key] = v
        else:
            _constraints = None

        return _constraints

    @check_constraints.setter
    def check_constraints(
        self,
        value: dict,
    ) -> None:
        """Dataset's delta table check constraints setter method.
        Args:
            value (dict): inptut dictionary in the format:
                            `{"constraint_name": "constraint definition"}`
        """

        if self.table_name:
            _existing_constraints = self.check_constraints
            _new_constraints = value

            logger.info(f"Applying check constraints on '{self.table_name}':")

            if not self.keep_existing_check_constraints:
                for k, v in _existing_constraints.items():
                    if k not in _new_constraints:
                        _sql = f"ALTER TABLE {self.table_name} DROP CONSTRAINT {k}"
                        self.spark_session.sql(_sql)
                        logger.info(
                            f"The constraint '{k}' has been dropped from the "
                            f"table '{self.table_name}'"
                        )

            for k, v in _new_constraints.items():
                _constraint_name = k.lower()
                logger.info(
                    f"Checking if constraint '{_constraint_name}' was "
                    f"already set on {self.table_name}"
                )

                if _constraint_name in _existing_constraints:
                    logger.info(
                        f"The constraint '{_constraint_name}' already exists on the table"
                    )
                else:
                    if v in _existing_constraints.values():
                        logger.warning(
                            f" The constraint definition '{v}' already present on the table"
                        )
                    else:
                        _sql = (
                            f"ALTER TABLE {self.table_name} ADD CONSTRAINT "
                            f"{_constraint_name} CHECK ({v})"
                        )

                        self.spark_session.sql(_sql)
                        logger.info(
                            f"The constraint {_constraint_name} has been successfully "
                            f"added to '{self.table_name}'"
                        )
Alternatively, the source code is documented, maintained, tested, and constantly updated as a GitHub-hosted open-source project. So the usage is a few lines of the code away:
# %pip install spalah

from spalah.dataset import DeltaProperty

dt = DeltaProperty(table_path='/tmp/sample_delta_dataset')
print(dt.properties)
Final Words
Although Delta is a self-sufficient and mature dataset format, sometimes it must be additionally configured, and specific table options, constraints, and metadata to be added.
While all that is possible via SQL DDL commands, it is just not handy to use at scale. Therefore, Python abstractions come into the picture with the hope that, eventually, something similar will be a part of the official Delta-Spark package.
Currently, DeltaTableConfig fills the missing functionality and helps manage delta properties and constraints in a Pythonic way and at scale.
Thank you for reading.

Towards Databricks Certified Data Engineer Professional
I decided to obtain the Databricks Certified Data Engineer Professional recognition within 2023. It was a New Year Resolution goal that resonated well with my career path. Surprisingly, few related study materials, blog posts, or forum discussions were available. I passed the exam on the first try, though, going blindly. This story is a compilation of memories and bits of advice on how to get ready and perform optimally during the exam.
How was it different from Databricks Certified Data Engineer Associate examination experience?
This is the common question I’ve heard recently, and it makes sense because the first logical step before passing the Professional examination is to complete an Associate’s one.
The Databricks Data Engineer Associate certification is more accessible due to various reasons:
- The difficulty and deepness of the questions.
- It has fewer questions (however, also equally, the duration is shorter).
- The available free practice test precisely represents the difficulty of the exam so that an adequate self-estimation can be accomplished ahead.
That said, the candidate with six months of daily Databricks usage may be ready for the associate-level testing. Getting the associate-level certification is a wise step before running professional accreditation.
Getting ready for the exam
Get sufficient Databricks experience
I would advise considering professional certification if you spent with Databricks (or Spark) at least 18–24 months and already had a chance for hands-on experience with things like Structured Streaming, Jobs APIs, Compute Pools, and the choice between Delta Merge vs. DataFrame.Write is not an issue.
Schedule the right exam time
Each person has (his/her own) optimal alerting time. This is the daily repeating period of complete focus and cognitive performance. Mostly this is a time when it is easy for you to execute linear tasks sequentially. In my case, this period is the morning hours supplemented by enough caffeine and a night of good sleep.
I highly recommend scheduling the exam at this time and avoiding hours of energy deep or evening hours when your body and brain are ready for sleep. This is going to be especially important for such an intense exam.
Prepare the workspace
If you schedule the online exam, ensure that nothing will interrupt you.
You will not be able to use noise-canceling headphones, so choose a quiet room and close the windows to avoid potential noise from outside.
It might be that just before the start of the exam, the environment is ambient, you hear only birds from the backyard, and nothing can go wrong. However, in half an hour, the situation might change, and road workers started fixing something nearby. You cannot leave the seat during the exam because your webcam tracks you. If that happens and you will stand up for a walk to the other side of the room, for instance, to close the door or window, be ready that exam might be canceled.
For a few hours, consider keeping your family members, pets, and other home inhabitants away from the examination room. All you need is a complete focus during that time.
During the exam
Time management
This is probably the main advice — do not get stuck on complex questions. Some of them will take plenty of time even to read. If you get into such one and do not have a quick answer, mark it for a later review and skip it.
Evaluate all available answers
Because of the time pressure, I tended to choose the “good enough” answer to win some time. Luckily, I quickly realized that there were better strategies than this. The answers are often very similar and look correct at first glance, but this exam intends to determine if you understand those more minor details hidden behind each variant. Therefore, scanning and evaluating each answer before moving to the next question is better.
Keep the most challenging questions for later
This examen has 60 questions and only 2 minutes per each to read, understand, evaluate all answers, and then choose the proper one. After answering all “doable” questions, you will likely have some time in reserve. Use it for challenging items.
The hint to the correct answer might be a part of sub-sequential questions.
Exam topics to put an extra attention
I do not think that I am allowed to disclose exact exam questions and answers. However, I believe I can share a general notion of the exam. The questions were mainly constructed to test the practical knowledge and understanding of the data platform.
In my case, the following few categories were dominant. Also, in contrast to the Associate exam, this time, I didn’t get any Delta Live Table questions.
Structured Streaming:
- Types of triggers: availableNow, Once, processingTime.
- Watermarking and processing windows
- Role of streaming checkpoints
Processing Strategies:
- Scenarios to use Delta Merge
- Cases when DataFrame.Write is optimal
- The order of operations and the impact on deduplication
- The logical outcome of the chain of transformations on the DataFrame
Databricks Management and Automation:
- The use of various rest APIs. For instance, what will happen if Create Job API runs three times with the same payload?
- The use of Compute Pools
- User Access management and privileges, especially in the light of the Unity Catalog
- Integration with the source control using Git Repos
- Databricks SQL Alerts and Dashboards
Final Words
The Databricks Certified Data Engineer Professional is a challenging exam. It is also a fair one. It touches perhaps all aspects of the Databricks platform and checks your knowledge and understanding of the optimal use of the components in various situations. So I wrote this article to put all the memories together. I hope someone will find it helpful and actionable and eventually experience the same satisfaction and relief by observing the final score page. Good luck!
Delta-RS & DuckDB: Read and Write Delta Without Spark
I have used Apache Spark (often as Azure Databricks) for some years and see it as a sledgehammer in data processing. It is a reliable tool built on JVM, which does in-memory processing and can spin up multiple workers to distribute workload to handle various use cases. It does not matter: whether small or considerable datasets to process; Spark does a job and has a reputation as a de-facto standard processing engine for running Data Lakehouses.
There is an alternative to Java, Scala, and JVM, though. Open-source libraries like delta-rs, duckdb, pyarrow, and polars often written in more performant languages. These newcomers can act as the performant alternative in specific scenarios like low-latency ETLs on small to medium-size datasets, data exploration, etc.
This article is a form of POC exploration with a bit of benchmark to see what is currently possible.
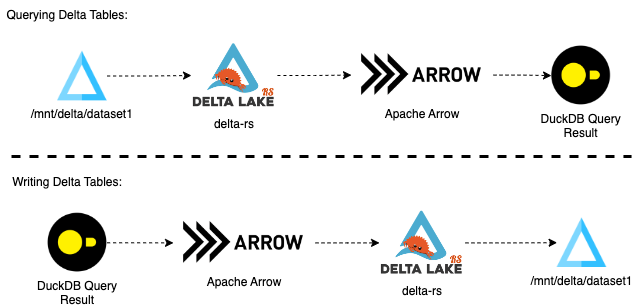
So why Delta-RS and DuckDB?
- Delta-RS library provides low-level access to Delta tables in Rust, which data teams can use in data processing frameworks. It also provides bindings to another higher-level language – Python.
- DuckDB is an open-source in-process SQL OLAP database management system.
The solution is a combination of those two libraries with Apache Arrow as the columnar in-memory format:
Databricks Observability: Processing Collected Ganglia Metrics
Introduction
In this article, we will explore the use of collected Ganglia metrics and their preparation for observability tools like Grafana. We will begin by examining how the metrics files are organized and what kind of content they hold. Then, we will discuss how the metrics going to be processed by creating a notebook to ingest XML files. Finally, we will push the metrics to Azure Data Explorer.
This article depends on the previous story: Databricks Observability: Collecting Ganglia Metrics and uses the outcome of the init-script discussed there.
The processing flow
Before the implementation part starts let’s briefly discuss the logic behind the processing.
In a nutshell, it has a few steps:
- Move logs from the landing to the processing directory
- Generate Pyspark dataframe by processing xml logs
- Push the content of the dataframe to Azure Data Explorer
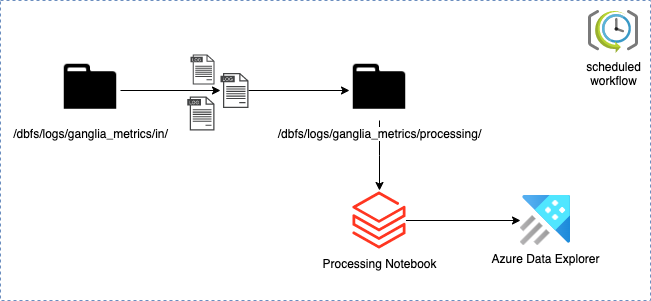
Each of these steps will be covered later in the implementation part.
Continue reading…