Databricks Observability: Collecting Cluster Ganglia Metrics
Introduction
This blog post is about a few host metrics like CPU and RAM usage and their importance in understanding cluster utilisation. The simple task of tracking them might turn into a non-trivial task if the number of clusters growing over time. The real challenge is to track such metrics for short-living job clusters. This post is the first one in related series and I will discuss further the problem of getting metrics gathered and the possible solution.
The problem: Data team has many clusters to monitor
Databricks cluster utilisation monitoring might be a simple task if the data team has a few “permanent” clusters to perform all data processing. These clusters have ganglia endpoints, so bookmarking the ganglia pages and checking each cluster’s health by looking into CPU, Memory, and Network charts from time to time might be enough to understand how clusters are doing.
However, things might be more complicated if the data team has dozens or even hundreds of clusters. Checking each cluster’s ganglia page to see bottlenecks or underutilisation will be tedious daily OPS work.
It might be even worse in case of workflows scheduled to run on job clusters that are created/destroyed during each run. In this case, the number of clusters might be counted in thousands per week. How then data team can see the average utilisation of the cluster that has about 15 minutes of the lifetime?
The solution: Collect cluster metrics centrally
The solution is to collect cluster metrics centrally and store them for further observability using the push approach. Ganglia is a monitoring system that can be used to collect cluster statistics. But it will not be available when the cluster has already been destroyed.
A bash init script can be used to collect cluster metrics, and then store them in a central location. The script will start in the background during cluster start-up and will continuously collect the metrics at a specified interval and store them in a dbfs location shared among all clusters in the workspace.
These metrics can then be used with observability tools like Grafana to monitor cluster health and performance:
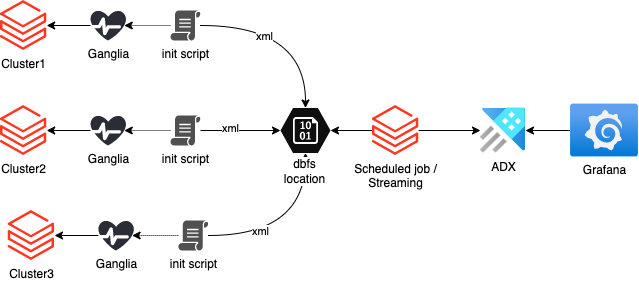
This blog post will cover the first part of the challenge: gathering data centrally to DBFS location.
Continue reading…Databricks Certified Associate Developer for Apache Spark 3.0
A few days ago I passed this assessment and it was special for me due to a few factors. This is my first vendor-specific non-Microsoft certification. And this is the very first time when I must complete it fully online. In this post, I would like to cover those factors, so I hope it will be helpful for someone who wants to pass it also and has Microsoft certificates only.
Planning and registration
The very first step is to get an exam planned. In the same way as Microsoft, Databricks uses a third-party service for running and measuring assessments. In their case, it is a KRYTERION. The algorithm of the registration procedure is also pretty much similar to what I had earlier with bigger vendors:
- By using a Databricks Academy I’ve chosen which assessment I want to complete
- The registration button forwarded me to KRYTERION’s Webassessor portal where I had to register and then choose an assessment again.
- The next logical step was hardware testing: a web camera, a microphone, and finally – network bandwidth.
For MacBook users: All my tries of a network bandwidth test in Safari failed, while this was successful in Google Chrome. Anyway, I decided to use my Windows 10 laptop. - Then, the registration by itself and payment checkout.
- As the final steps, I had to prepare my laptop for an exam, so a specialized software package called a “Sentinel” was be installed
- In the end, the biometric profile is to be created. Luckily creation of it was a fairly simple process and somehow similar to an initial setup of Apple Face ID: The webcam captured my face when I slightly rotated it till a high index value was displayed so I was able to finalize this process.
It is also safer to enroll in an assessment and pass it using the same hardware. This warning I found on the official website:
Sentinel analyzes your typing style. If you attempt to test on a different computer or keyboard than the one you used to establish your biometric profile, your identity may be called into question. Your exam may be delayed or cancelled until your identity is confirmed.
The process of assessment
It was not smooth initially. A few minutes after the beginning of the assessment it was interrupted by a Kryterion Support staff, the support forwarded me to a specialized chat page where I was kindly asked to restart my notebook. The reason: the web camera did not work correctly. I was informed that the exam timer was paused, and I will return to my progress after reboot.
I restarted the laptop and re-joined the exam, however was still locked on the initial support page. I could still see their messages with an original request for a laptop restart, so after a few minutes of waiting, I typed a confirmation that I am ready to continue. Then within the next 15 minutes, I repeated the same statement a few times again. However, without any reaction from the other side of the screen.
Luckily, I spotted an exclamation button on the title bar and pressed it which triggered someone from a support team to get in contact with me so the assessment process was finally unblocked.
Besides that incident, everything else went just the same way as I contemplated many times earlier in testing centers like Pearson VUE or Prometric. I had to read questions and answer them. When all questions were done, I had to submit an assessment’s results and finalize the session.
Luckily, I received relieving passing result immediately and a copy of my score was also sent to my email box. The official Databricks results and the exam badge arrived in a few days.
Therefore, besides the technical issues, an online experience of Kryterion is very similar to what I had earlier by taking exams in centers like VUE and Prometric.
Was it an easy exam?
My answer will be very subjective. Nevertheless, I think it is doable to beat an exam for a candidate with 6+ months of active daily PySpark / Databricks use.
The candidate will see some internal architecture questions, so a prior reading of the book Spark: The Definitive Guide is highly recommended even by authors of the exam.
For instance, this image should contain any secrets on what’s going on there:
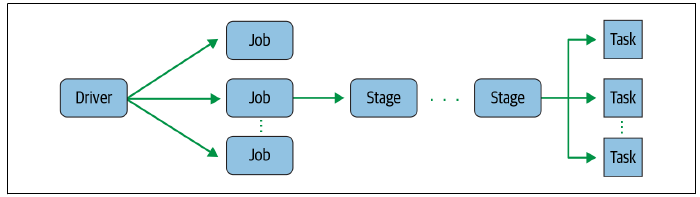
I cannot disclose real questions I’ve seen, so can only express abstract comparable alternatives to give an idea. The candidate should be ready for questions like “what is the name of setting that controls the default number of partitions during the shuffling?” or “how many executors can run simultaneously on one worker node”, etc.
The majority of questions will be related to Spark’s DataFrame API. An example:
Identify an error in the following line of the code and choose the right answer:
dataframe1.join(dataframe2, “inner”, “ProductID”)
For those who use Spark daily, the answer is obvious – it is an order of parameters.
However, I think that exam can be tough for someone who has only theoretical knowledge and minimal real practice, for someone who perhaps still uses snippets from StackOverflow for basic Spark transformations, like joins, projects, unions.
Mainly because many questions are tricky. They have very similar answers and only small deviations among them helped me to choose the right one. Due to this reason, I think it will be hard to memorize syntax using theoretical knowledge only. The hands-on experience which is turned into a muscle memory on Spark API syntax is very recommended.
Final words
I hope that this post will be helpful for someone who is preparing for such certification and going to try it. The assessment is well written and doable for a specialist with real-world hands-on PySpark / Databricks practice. Nobody is protected from the hardware issues, fortunately, during my session, Kryterion support staff was ready to help me with it.
Many thanks for reading.
Data Engineering Development Environment using WSL and Miniconda
Recently I managed to get the Windows Subsystem for Linux configured on my Windows 10 workstation. So, the logical next step was to use it by getting the PySpark installed, configured, and running there. However, instead of running dozens of pip install and manual post-configuration of all those packages, I decided to rely on the packaging functionality of Miniconda. Eventually, it saved me plenty of time.
Why I use Miniconda?
Miniconda is an open-source package and environment management system. It not just installs, runs, and updates packages and their dependencies, but also it easily creates, saves, loads, and switches between environments on your workstation. As the package manager, it became popular among data engineers/scientists. Some you perhaps will ask, why I did not just use pipenv or virtualenv?
This is what a popular thread on stack overflow states:
Having been involved in the python world for so long, we are all aware of pip, easy_install, and virtualenv, but these tools did not meet all of our specific requirements. The main problem is that they are focused around Python, neglecting non-Python library dependencies, such as HDF5, MKL, LLVM, etc., which do not have a setup.py in their source code and also do not install files into Python’s site-packages directory.
StackOverflow – What is the difference between pip and conda?
There are few more reasons for using WSL and Conda:
- I like to have a clean workstation. I will just shut down WSL when I do not need to work with PySpark.
- The common modern DE packages, like Apache Spark, Airflow, Pandas feel Linux like home. They often ported to Windows, but sometimes with limited functionality and stability.
- When I do not need the environment, I need just to run
conda env remove -n ENV_NAME. This will clean custom packages installed there, environment variables, and clean all dependencies. - Visual Studio Code can work use conda environments that run in WSL the same way as it uses local python installations
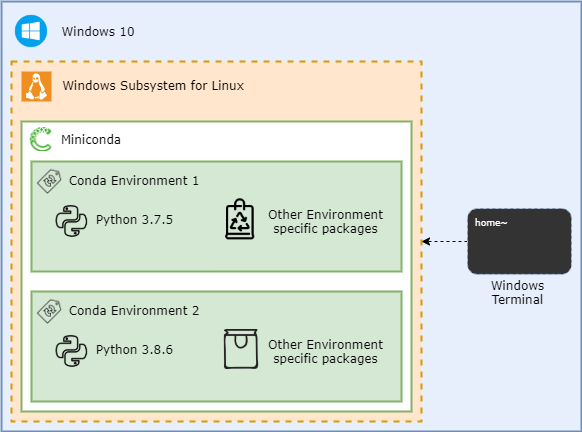
Logically, the configuration looks like a set of nested containers. Each can be re-created, re-installed, so this gives some level of abstraction, and makes my life, as Data Engineer, slightly easier:
Preparing Windows 10 for Data Engineering or WSL(2) ❤ Windows Terminal
Recently I have to rethink the way how I use Ubuntu as the local sandbox environment. The common approach was to have a small-sized VM running in the VirtualBox or sometimes even a dedicated VM in Azure/AWS. However, Windows Subsystem for Linux (or WSL) sounds more and more often as the lightweight and easy-to-use alternative to dedicated VMs. So, I performed an exploration which eventually resulted in this blog post.
TL/DR
Apparently, WSL can be a fully functional alternative to side-by-side VMs and brings effectively two very different worlds of Windows and Linux together.
So, why spend time to get WSL working?
- WSL offers integration possibilities:
- Cross OS accessibility of files – Windows files are visible in BASH and the Linux filesystem is available in Windows CMD / Powershell
- The output of the Windows console app can be piped to Linux command (like
grep) and then piped back to another windows console application. - Visual Studio Code that runs on the Windows side can be configured to work natively with the files stored in Linux OS (this requires an extra plugin though).
- In general, WSL is more lightweight than a dedicated VM that runs on the same workstation.
- It shares the resources of the workstation and can use all hardware capacity when needed and then downscale if those resources not needed anymore:
- The VirtualBox usage scenario means that the part of CPU and RAM is allocated to the Linux VM and they are not available for Windows programs
- WSL starts in a second or two, while it takes sometimes minutes of waiting for the startup of a dedicated VM. Also it shutdowns in seconds
- Finally, WSL has a handy integration with Windows Terminal. For example, It automatically adds new profiles when the new distribution is installed. After small tuning (which will be covered later in this post) it can look like this:

Luckily, the installation process is fairly simple and documented well by Microsoft. However, there are few caveats related primarily to the corporate laptops that I will describe later.
Continue reading…Azure DevOps for SQL Server DBAs. Part 3 – Continuous Delivery of SQL Agent Jobs
In this final post of the DBAs DevOps series, I would like to talk about the remaining piece of the puzzle – delivery of SQL Agent jobs using the pipeline. I will discuss various approaches that can be used and then perform a test drive of the metadata-driven way of delivering the jobs.
Prerequisites
- An Azure DevOps project. It is used through the series of related posts as the container for the source code and deployment pipelines.
- Because this is the last post of the “DBA DevOps series”, it depends on the dba-db database project and deployment pipeline created earlier.
Why SQL Agent jobs should be also included in the DBA’s database project?
In the previous two posts, I’ve shown how DBA teams can use Azure DevOps to create deployment pipelines and Azure Data Studio to maintain database projects. These tools can work together to consistently deliver the maintenance code to the on-premises SQL Server estates. However, bringing tables, views and stored procedures is only part of the story of the automation for DBAs. Those objects mostly rely on SQL Agent jobs as the scheduling service.
Therefore, it would be beneficial to have a pipeline that delivers not just stored procedures and tables but SQL Agent jobs.
Another reason is that “one-time-delivery” of the jobs is not enough. Jobs by themselves also need to be updated time-to-time. Think of changes in job steps, job categories, job notification settings, etc. The pipeline can take care of all that as well.
Some real-life cases where automated delivery of SQL Agent jobs can help:
- Creation and decommission of the jobs
- Addition of the new step in the existing job
- Change the “retry_attempts” and “retry_interval” settings of the job steps
- Change of the parameters in the maintenance procedures
- Change the jobs logging output location and notification settings
If the number of instances is very low, perhaps investment into the automation could be overkilling. However, if the count is measured in hundreds or thousands, pushing jobs changes to the entire estate by the pipeline can take minutes instead of days.
Metadata-generated jobs instead of pre-baked scripts
The other aspect to consider is the way how jobs can be delivered. The default and perhaps the simplest option is merely placing job scripts “as-is” into the dacpac and run them by the “Post-Deployment Script”.
The advantage of such an approach is that the job script acts as the monolithic single unit of delivery. This brings benefits:
- It is easy to add such scripts to the database project
- Easy maintenance in a Git, in the end, it is just a job script generated by SSMS (or another tool that uses SMO)

However, this approach has also disadvantages. Because scripts are monolithic units of delivery, re-deployment options of such jobs are limited:
- Redeployment of the job means its deletion and re-creation with some negative effects:
- All customizations, like adjusted job schedules, will be lost during the re-creation
- The job execution history will also be lost due to re-creation
These limitations can be blockers, especially if some jobs are customized requested by requests of the end-users.
A declarative way of jobs delivery
Declarative delivery of jobs is another approach. The idea behind it is that the pipeline delivers records with metadata of what we expect to see on the database server. So, instead of pre-baked scripts with direct instructions of how prescribed jobs should be created, the pipeline delivers only the list of jobs and job steps. Then, the post-deployment script triggers the deployment procedure to bring the instance to a “desired state”. Logically, this method works this way:

The dacpac firstly synchronizes metadata tables and then it triggers the procedure usp_jobs_DeployJob. The procedure iterates through each record and brings the instance to the desired state:

The deployment process depends on the deployment mode of a particular job and the current state of the target instance.
Continue reading…